Data Viewer User Guide
Introduction
The city of Astoria has produced this data viewer to help you interact with GIS data that originate from a variety of sources. GIS data are presented as a catalog where individual layers can be checked on or off according to your desire. The catalog contains taxlots illustrated lines. Taxlot labels can added by checking the box on the corresponding layer and an address, taxlot number or lot size text will appear in the center of each taxlot. Following the sections presented below, you will be able to perform many functions such as selecting one or a group of taxlots. Producing lists containing taxlot attributes in a column. Printing a map. A link to the Clatsop County Assessor is available any time by clicking on the underlined blue taxlot number hyper-text. You can draw new features or upload existing features of your own into the surface of the map using drawing and mark-up tools.
The data catalog provides a variety of data overlays that are often transparent. Fore example, city zoning is presented as a colorful and transparent overlay containing a label indicating the zoning classification. Selecting a feature on the map while the zoning layer is on produces a zoning attribute in the column to the right of the map. Selecting the zoning link located under the description will open a full description of the zoning type in a new window.
FEMA Flood Zones are presented as a colorful transparent layer. Selecting FEMA Flood Zones will produce an attribute in the list located to the right of the map. Several layers of air photos and historic air photos are available in the catalog ranging in age from 1966 to 2021.
Page Layout
The data viewer is comprised of four parts: the Tool Bar, Map Display, Table of Contents and Footer. The Map Display is an interactive map which allows you to visualize the data layers. There are two types of tools found on the Tool Bar, Navigation and Action. The first tab in the Table of Contents section is the Catalog. The Catalog shows a list of folders that house the data layers you can add (turn on and off) in the Map Display. Additional tabs are added to the Table of Contents section as you use different tools in the Tool Bar. The Footer displays the current location shown of the Map Display both x and y coordinates and in latitude and longitude. The Footer also displays the current scale of the Map Display.
Navigation Tools
The cursor allows you to re-center the map without zooming in or out. To pan, click on the map at the point you wish to be the center of the map or press and hold the left mouse button down and drag the map to the desired location and release the left mouse button.
The Zoom In tool allows you to zoom in to an area smaller than the area currently visible on the map window. To zoom in to a specific area of interest, click the Zoom In button in the Tool Bar and move your cursor to a corner of the map you wish to zoom to. You can also press and hold the left mouse button and drag a rectangle around the area of interest. When you have defined the zoom-to area, release the left mouse button. The map will zoom into the area you designated. Alternatively you can click anywhere on the map which will zoom the display to that specific location.
The Zoom Out tool allows you to zoom out to an area larger than what is currently visible on the map window. To zoom out, click the Zoom Out button in the Tool Bar and then click on the map at the spot in which you want to zoom out from. The map will zoom out and re-center on that point. Alternatively you can click and drag the zoom out window. When you have defined the zoom-out area, release the left mouse button. The map will zoom out around the area you designated.
Catalog Tab
The first tab in the Table of Contents is the Catalog tab. The Catalog is where you can access and activate data layers to view in the Map Display. Folders in the catalog categorize data layers by how that information is related to city planning. The top level folder categories are: City and Urban Growth Boundaries, Regulatory Layers including city zoning, Planning Inventories, and base air photos. Click on the folder name to expand its contents. Within these top level folders there may be additional folders to further sort the data layers into groups. Data layers can be activated to view in the Map Display by clicking the box next to the layer adding a check mark. Multiple data layers can be checked at the same time, but only one base map can be active at a time. Once you click a data layer, it will draw in the Map Display. You may have to zoom in on the Map Display to see the labels for the active layer. In the Catalog tab, below an active layer some additional information may become available. Along with the data layers legend, a small Information Button will also appear.
The opacity of transparent overlay layers can be controlled using a fade/un-fade tool that is located under each layer. Transparent layers are by default given a certain amount of transparency that can be changed using this tool.
The Search Catalog box appears at the top of the Catalog. It can be used to quickly find the layer you are looking for by typing in a portion. Fore example 'zoning' will return every layer containing that theme in its name.
Results Tab
The Table of Contents will be hidden if you click on the Results tab. Once the Table of Contents is hidden. Clicking on this button again will make the tabs visible again. The Results tab generally opens automatically as a result of using an Action Tool such as Identify, Select or Search. Items appearing in the Results are listed and can be removed or reset by clicking on the trash can in the Results banner at the top of the Results section
User Guide Tab
The Table of Contents will be hidden if you click on the help tab. Once the Table of Contents is hidden, the User Guide content will be displayed
Legal Disclaimer Tab
The Table of Contents will be hidden if you click on the Disclaimer Tab. Once the Table of Contents is hidden, the Disclaimer content will be displayed
Action Tools
The Identify tool will allow you to find out more information about a geographical feature in the layers that you have activated. Click the Identify tool and you will see a new tab open in the Table on Contents.
When the new identify window opens in the Results Tab, click on the map and draw a single point on the feature you want to select and click Go. The results will be displayed in the Results box.
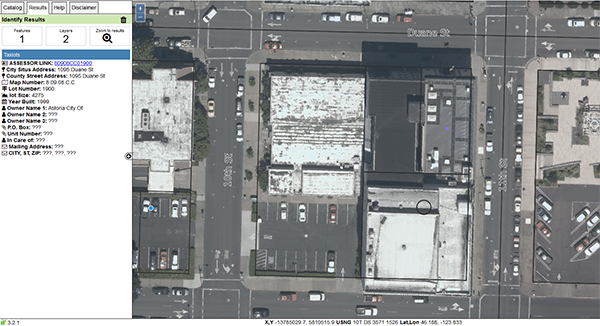
Any additional information available about that feature will be displayed in the Identify tab.
The Measure tool allows you to measure the length of a line or the area of a polygon. Click on the Measure tool in the Tool Bar. A new measurement tab will open in the Table of Contents section of the viewer.
First, select your measurement units. Begin measuring by clicking the mouse at the start of the line you would like to measure in the Map Display. Double click the mouse to finish measuring. The results of each line length along with the compass bearing of each line are shown at the the bottom of the results tab.
The Draw Polygon tool displays the area of a feature you measure. Click on the Draw Polygon option in the Tool Bar. A new area section will open below the Table of Contents section of the viewer. First, select your measurement units. Begin measuring by clicking the mouse at one corner of the area you wish to measure in the Map Display. Continue to click at each corner of the feature and double click to finish measuring. The results are shown at the bottom of the Results tab.
Clicking on the Select Tool opens a new dialog box that contains some options
You can select features with the select tool by drawing a graphic that you select from the menu of options.
After you have made a selection, press the "Go" button.
Your results will appear in a list at the bottom of the map. Each field of information can be further sorted or filtered. You can create a list of features based on a graphic or a buffer around a graphic or selected tax lot using the Select Features tool on the Tool Bar. The first step is to activate the tax lot layer. Then click on the Select Features button and indicate how you would like to select the features, point, line or polygon in the Table on Contents Select Features Tab.
Then in the Map Display, select the tax lot of interest. Next click on buffer these results in the Select Features tab. Enter in the distance of your buffer in the buffer feature by box, select the desired units in the drop down box, and click "Go".
The Clear Selection button allows any highlighted feature to be cleared and removed from the map. This can be helpful after any of the interaction tools are used. Use the Select Results Trash Can on the green banner to remove any selected features
The Search Tool operates as a way to find what your looking for by entering a piece of the tax lot id numbers or owners name or situs address into the dialog window. The following rule applies: The less you type, the more results you get and alternatively, the more you type, the fewer results you get.
After entering information into the Search dialog box, click on the "Go" button where the results will appear in the Results Tab.
Clear your search before performing a new search by clicking on the trash can located at the top right hand side of the Search Results window. After clicking a new button will appear below.
Click on the CLEAN PREVIOUS SELECTION button to clear your previous search results and simultaneously refresh all of the records for a new search. If you use the IDENTIFY map tool, you will need to clear the previous search or no results may appear in subsequent searches
Click the Find Me tool to automatically have the map pan to your present location. If the map does not pan directly to your location, it may be due to internet connections.
Drawing and Mark-up Tools
Add Polygon, Add Line, or Add Point
To draw a new feature on the map, open the Draw Tools drop-down on the top of the Catalog. You can add a check mark next to Add Polygon, Line, or Point. After selecting a draw tool, click on the map where you would like your first corner on the drawing to appear. Move the mouse to draw your shape, clicking each time you want a vertex created. Double-click to finish the drawing.
Zoom to Features Extent

Click to zoom to the full extent of a mark-up feature in an individual sketch
Add Features from File

Click on this tool to add features from a file
Download Features to a File

Click on this tool to download features to a file
Add a Point Mark-up Feature

Click on this tool to add a point feature in the form of a mark-up graphic
Add a Line Mark-up Feature

Click on this tool to add a line feature in the form of a mark-up graphic
Add a Polygon Mark-up Feature

Click on this tool to add a polygon feature in the form of a mark-up graphic
Edit Mark-up Features

This tool allows you to edit the shape of polygons and lines, as well as move point sketches. After selecting this tool, click on the object you would like to edit. Blue circles will appear on the drawing indicating locations you may use your mouse to move the location of a vertex or add a new one. Once you are finished with your editing, click off the drawing object to complete the task.
Remove a Feature from the Mark-up Layer

Click on this tool to select and remove a mark-up graphic
Clear All Features from the Mark-up Layer

Click on this tool to remove all mark-up graphics
The Print Tool will allow you to create a PDF map of the current layers displayed in the Map Display which you can print or save. Activate the layers you would like to have displayed in your printed map and click on the Print tool in the Tool Bar. A Print tab will open in the Table of Contents.
You will have several options to customize the map. Create a Map Title, and set the Output Template in Portrait or Landscape. Adjust the image quality by selecting Normal, Higher or Highest print resolution. Press the Print tab and and wait a few moments. A PDF map will be created. Clicking on the download PDF will open the map in a new tab in your browser. Generating a map can take between 1 to 2 minutes. Once the map is created, save or print the PDF map to share your mapping results.
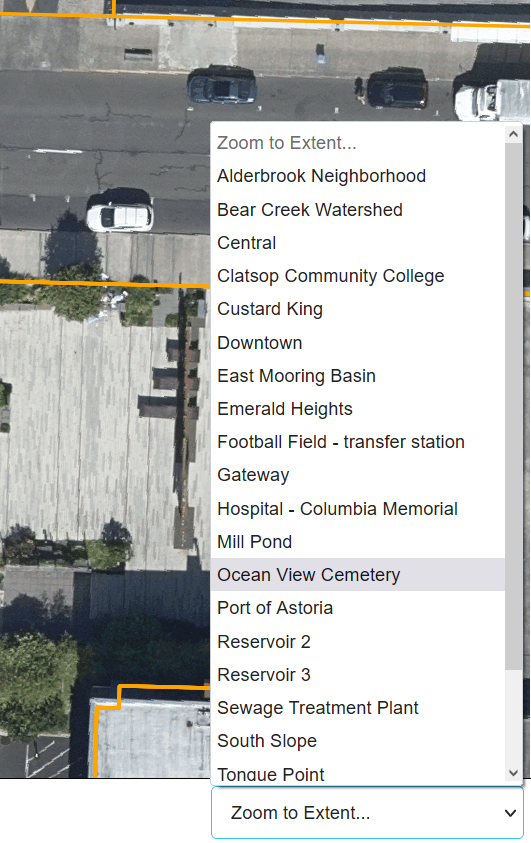
Ocean View Cemetery
Some of the information content of Ocean View Cemetery can be searched and mapped using this GIS Application. Ability to open PDF documents.
Using the Search Tool, select search for Ocean View Graves. A window will open in the Results Tab containing search boxes where you can input information that can be used to search the grave site database maintained by the city. Options include: Grave Permit Number, Last Name, First Name, Date of Birth using the format: 07/04/1876 and Date of Death using the format 07/04/1976
To view the Cemetery Map, open the Zoom to Extent box located on the lower right of the screen. Choose Ocean View Cemetery and the map will pan to the cemetery.


Legal Disclaimer
The information provided in this GIS map is property of the city of Astoria unless otherwise indicated. All information contained in this GIS map are NOT AUTHORITATIVE and have NO WARRANTY OR GUARANTEE assuring the information presented to you is correct. The positions and information content of all features contained inside this GIS map correspond to only GIS source data itself. Do not rely on any locations and measurements obtained from this GIS map to provide you with information that can be reproduced on the ground. All spatial data contained inside this GIS map are NOT SURVEY ACCURATE and may be completely invalid. This GIS map cannot serve as a substitute for site-specific investigations by qualified practitioners. Site-specific data may give results that differ from those shown on the map. This GIS map cannot be used as a substitute for a professional land survey or official source of information. Contact Clatsop County government to obtain official information regarding Clatsop County. The city of Astoria has exerted a tremendous amount of effort to bring you the best map information available; however in this GIS map, the city of Astoria cannot accept any liability for error. The city of Astoria assumes no liability for any decisions made or actions taken or not taken by the user of the GIS map.
Conditions for use
By using this GIS map as a source of information, you agree to accept any limitation known and unknown. GIS maps and data do not carry legal authority to determine a boundary or the location of fixed works and are intended as a location reference for planning, infrastructure management and general information. The city of Astoria provides this information on an 'as is' basis without warranty of any kind, expressed or implied, including but not limited to warranties of merchantability or fitness for a particular purpose. The city of Astoria assume no responsibility for anyone's use of this information. The city of Astoria shall assume no liability for any errors, omissions, or inaccuracies in the information provided regardless of how caused. Furthermore by accepting these conditions for use, you must also agree to indemnify, defend against, and hold the city of Astoria harmless for any claim or other liability imposed or that may arise from use of this GIS application, data and maps.